Invasion and the evolution of speed in toads
Invasion and the evolution of speed in toads
Benjamin L. Phillips, Gregory P. Brown, Jonathan K. Webb, Richard Shine Nature 439 page 803
I originally stumbled across this paper through a post on Pharyngula, a couple of weeks back and commented there on it . On the surface the paper makes sense. Cane toads were introduced to Australia about 70 years ago as a management to control pests and as almost all of these introductions go, the cane toads then went on to become a problem themselves. Since the original introduction the range where the toads can be found has increased, dramatically so in the last twenty or so years.
In the brief communication they present these four graphs to support their hypothesis.
I’m not really convinced by their statistics in this paper. Lets begin with the first graph, Graph a. I think that there is a good argument to be made that the results that they show here could just be due to small sample size, at least for the toads with relatively shorter legs. When I look at this graph I see the main cluster of points, then there are the three “outliers” with shorter relative leg lengths. Two of these outliers are within the range of values expressed by the points in the main cluster. While they can argue that this indicates a trend, I don’t find it convincing. To improve this graph, in my opinion, rather than just take a random sample of toads and radio track them, they should have attempted to set a representative sample of toads. Some form of stratified sample where there is more replication of the toads with relatively shorter legs.
Graph b, I find the most convincing of the four graphs presented here. It looks like the first 200 or so toads to arrive have longer legs.
Graph c, I don’t find very convincing at all. The regression line they present has a small r2 value indicating that is explains very little of the variance in the data, and I wonder how of the relationship in that graph is determined by the individual point that occurs quite high up on the y axis. Another question, which occurs to me as I type this, what is a biologically relevant difference in relative leg length?
Graph d. This graph is quite interesting. Looks suspiciously like an exponential curve.
The authors present regression lines in their graphs, but talk about correlation coefficients in the text. I would have liked to see the coefficients for the regression lines in the text. Correlation doesn’t imply causation between two factors whereas a regression implies that one of the factors explains the other, something that they are trying to do within their paper. Admittedly, there is only limited space in a “Brief Communication” to Nature. I for one, would have liked to see the standard errors and confidence intervals for the regression coefficients.
The central thesis to the paper makes sense, and is believable. I just think that their graphs are at best indicative of this. I'd be hapier if there first graph was stronger, in that they a had more conclusive relationship between leg length and speed of movement. While the rate of advance of the toads into virgin territory has dramtically accelerated over the last twenty years, there's more going on than just an increase of leg length. While the authors attempt to show a change in leg length between older and newer populations, the change in leg length between them is small, and not enough to explain teh dramatic acceleration.
Benjamin L. Phillips, Gregory P. Brown, Jonathan K. Webb, Richard Shine Nature 439 page 803
I originally stumbled across this paper through a post on Pharyngula, a couple of weeks back and commented there on it . On the surface the paper makes sense. Cane toads were introduced to Australia about 70 years ago as a management to control pests and as almost all of these introductions go, the cane toads then went on to become a problem themselves. Since the original introduction the range where the toads can be found has increased, dramatically so in the last twenty or so years.
Here we show that the annual rate of progress of the toad invasion front has increased about fivefold since the toads first arrived; we find that toads with longer legs can not only move faster and are the first to arrive in new areas, but also that those at the front have longer legs than toads in older (long-established) populations.
In the brief communication they present these four graphs to support their hypothesis.

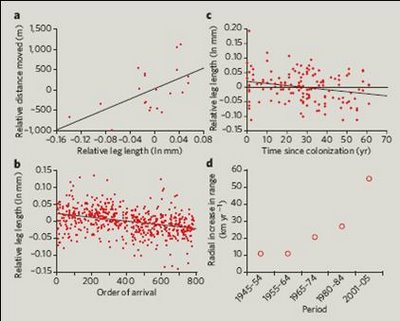
Figure 1 Morphology of cane toads in relation to their speed and invasion history.a, b,Compared with their shorter-legged conspecifics, cane toads with longer hind limbs move further over 3-day periods (r2 0.34) (a), and are in the vanguard of the invasion front (based on order of arrival at the study site; r2 0.11) (b). c,Cane toads are relatively long-legged in recent populations, and show a significant decline in relative leg length with time in older populations (r2 0.05). d, The rate at which the toad invasion has progressed through tropical Australia has increased substantially since toads were first introduced in 1935 (r2 0.92).
I’m not really convinced by their statistics in this paper. Lets begin with the first graph, Graph a. I think that there is a good argument to be made that the results that they show here could just be due to small sample size, at least for the toads with relatively shorter legs. When I look at this graph I see the main cluster of points, then there are the three “outliers” with shorter relative leg lengths. Two of these outliers are within the range of values expressed by the points in the main cluster. While they can argue that this indicates a trend, I don’t find it convincing. To improve this graph, in my opinion, rather than just take a random sample of toads and radio track them, they should have attempted to set a representative sample of toads. Some form of stratified sample where there is more replication of the toads with relatively shorter legs.
Graph b, I find the most convincing of the four graphs presented here. It looks like the first 200 or so toads to arrive have longer legs.
Graph c, I don’t find very convincing at all. The regression line they present has a small r2 value indicating that is explains very little of the variance in the data, and I wonder how of the relationship in that graph is determined by the individual point that occurs quite high up on the y axis. Another question, which occurs to me as I type this, what is a biologically relevant difference in relative leg length?
Graph d. This graph is quite interesting. Looks suspiciously like an exponential curve.
The authors present regression lines in their graphs, but talk about correlation coefficients in the text. I would have liked to see the coefficients for the regression lines in the text. Correlation doesn’t imply causation between two factors whereas a regression implies that one of the factors explains the other, something that they are trying to do within their paper. Admittedly, there is only limited space in a “Brief Communication” to Nature. I for one, would have liked to see the standard errors and confidence intervals for the regression coefficients.
The central thesis to the paper makes sense, and is believable. I just think that their graphs are at best indicative of this. I'd be hapier if there first graph was stronger, in that they a had more conclusive relationship between leg length and speed of movement. While the rate of advance of the toads into virgin territory has dramtically accelerated over the last twenty years, there's more going on than just an increase of leg length. While the authors attempt to show a change in leg length between older and newer populations, the change in leg length between them is small, and not enough to explain teh dramatic acceleration.
posted by Darkling at 16:05
![]()


0 Comments:
Post a Comment
<< Home